Today, I went digging through our forum stats to see how our baby is doing. Just over two years old now — she’s probably due for a checkup.
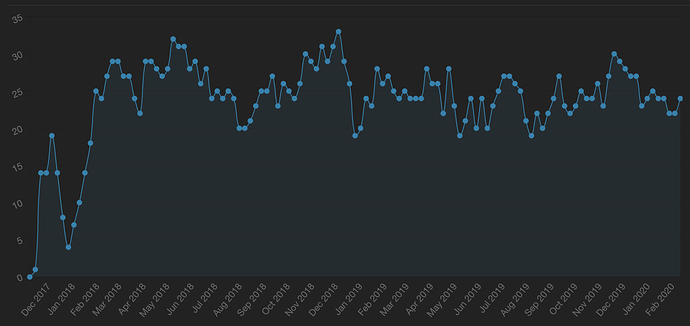
Daily Engaged Users
This is the number of people who liked or posted something on any given day.
On average, you can expect 24 people to be active on MEW on any given day.
You might think that Christmas and New Year’s are our quietest times of the year, but it seems that fewer people like and post stuff in the first week of work of the year.
Weekends are overall the quietest periods on the forum — no surprise there. That’s when we all get our game on so we have stuff to post about in the week!
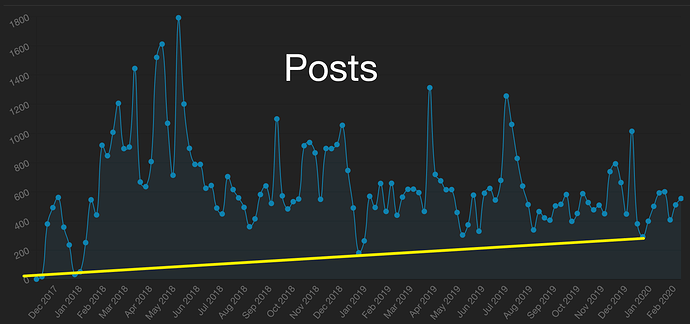
Posts
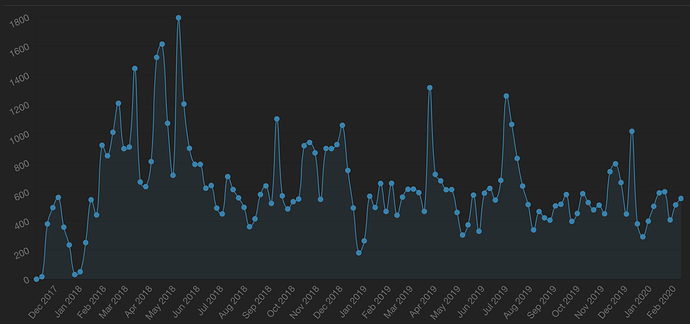
Number of new posts (per week?)
If I’m reading this graph right, it seems to show the number of new posts per week.
During the first few months of our forum’s existence, there was a flurry of posts. This is to be expected, as we were still figuring out all the cool stuff our new toy could do.
What is of particular interest is that after our first Christmas together here, post volumes never quite rebounded to previous levels. That’s not to say they have been low… apart from a few lulls, post volumes have been doing fine!
It was just interesting to see such a clear “before” and “after” break between December 2018 and January 2019.
However! Don’t be blinded by the peaks. There lurks an interesting insight if you look to the valleys… but more on that later!
User visits
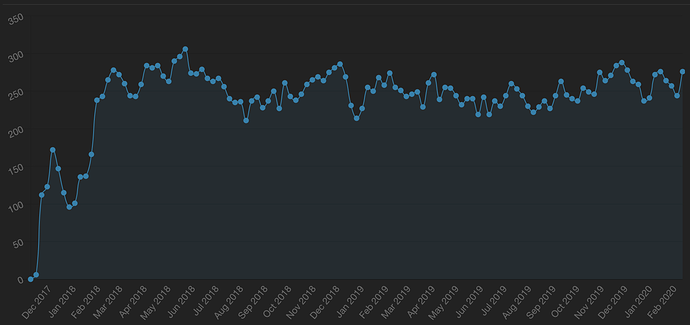
Number of visits from registered users (per week?)
The number of visits from users has been pretty steady since we started operating properly in February 2018.
DAU/MAU
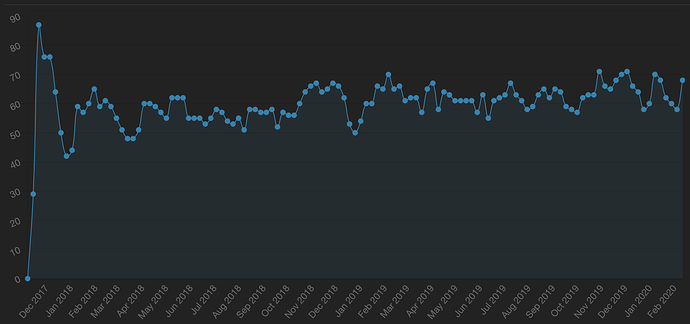
Daily active users over monthly active users. Number of users who logged in on a particular day, divided by number of users who logged in over the past month.
According to Discourse, this is a percentage which indicates community stickiness. It suggests that we aim for a ratio greater than 30%.
We are well over 50% and often touch 70%.
In other words, we have a very sticky community. Wash your hands once in awhile, people!
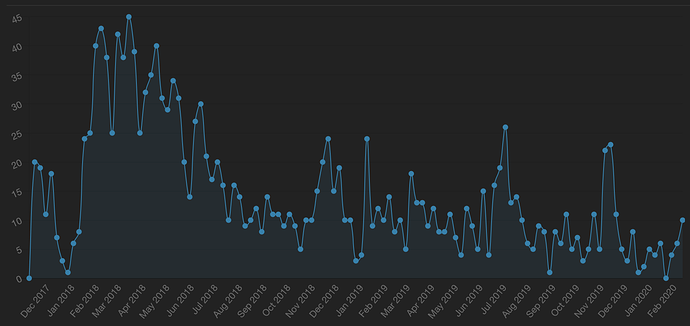
Topics
Number of new topics (per week?)
Once again, it is quite understandable that there would be a flurry of new threads topics at the birth of our forum.
In our community, I’ve noticed that we generally prefer to organise conversations neatly into one topic per subject. [Can’t I just call it a thread? No-one is going to understand this sentence! (Yes I’m talking to myself in text. Maybe I’m finally snapping.)]
Rather than create tonnes of new topics, we tend to return to post in older topics to keep the conversations together.
As a result, one should expect a dramatic drop-off in new topics given the fact that our daily active users and “stickiness” figures are so steady.
This graph, to me, illustrates the importance of @Solitude’s Brute Force initiative. It helps ensure there are constantly new topics for people to check out every week.
Don’t be like Gandalf and get distracted by mountains!
As mentioned in “Posts” above, I wanted to argue that we should not become too distracted by high peaks, and should appreciate higher valleys as well.
Take a look at the final graph below.
The yellow trendline is drawn through the December/Christmas “low activity periods”.
It shows that during the forum’s lowest activity times, the number of posts are increasing. In other words, the minimum “baseline” of activity in our community appears to be increasing. That’s a grand thing.
(Update) Tag! You’re it!
Hey, @DieGrootHammer: This is a love letter to you.
@Entity: We spoke about this some time ago. You actively worked to boost activity last year and I think the effect of your work is evident. Thank you. You can also see what that spike in activity in July last year looks like compared to “normal” weeks/months.
@Flex: You asked about this at Gauteng meetup. Here are the actual stats!
